People unfamiliar with digital control systems believe that the higher the sample rate, the better the control fidelity. It is true that control fidelity does improve with increasing sample rate, but only to a certain point. Beyond that point, the control is essentially analog, and no further improvement occurs. If the sample rate is increased even further, control fidelity actually degrades due to detrimental numerical effects such as coefficient quantization and roundoff error.
As will be demonstrated in this report, the rule of thumb for servohydraulic systems is that the optimum sample rate be fifty times the system bandwidth, defined as the oil column natural frequency (or any other dominant dynamic mode). The bandwidth of most MTS servohydraulic systems is 100 Hz or less, so a sample rate of 100 x 50 = 5 kHz suffices. Beyond this sample rate, there is little or no improvement in control fidelity.
The sample rate at which control degrades due to numerical effects is difficult to determine, since it depends on many factors such as numerical precision, signal amplitude and bandwidth, digital filter break frequencies, etc. It can only be found by exhaustive (i.e. expensive) testing.
Increasing the sample rate beyond the optimum point increases the cost of the real-time hardware. Also there is a lost opportunity cost: since much of the real-time processor bandwidth is wasted on computations that do not improve control fidelity, there is little remaining bandwidth for advanced control algorithms that do improve fidelity, such as Adaptive Inverse Control (AIC).
This report limits discussion to control sample rate. There are other sample rates in a controller, such as data acquisition sample rate. There may good reasons to have a data acquisition sample rate that is much higher than that of the closed-loop controller.
The following topics are considered:
- Control fidelity as a function of sample rate
- Control fidelity as a function of latency (defined as the number of samples of delay between reading sensor feedbacks and writing servovalve commands)
- Numerical effects
The conclusions reached in this report are summarized here:
- The optimum control sample rate for most MTS servohydraulic systems is 5 kHz. Higher sample rates yield little to no benefit.
- Obtaining higher sample rates by load-sharing between multiple real-time processors increases latency, which significantly degrades control fidelity.
Control fidelity was analyzed using frequency response analysis of a typical servohydraulic system of various bandwidths, sample rates, and latencies, and comparing:
- Closed-loop frequency response
- Disturbance frequency response
- Open-loop stability metrics:unity-gain and -180 degree crossover frequencies
The servohydraulic system model had the following characteristics:
- Hydraulic actuator was a "standard" design used for years to develop analytic and Simulink modeling tools.
- Payload was mass-only, with the mass varied to obtain oil column frequencies (bandwidths) of 25, 50, and 100 Hz.
- Servovalve bandwidth was limited to 2 x payload bandwidth.
- Feedback conditioning bandwidth was set to 10 x payload bandwidth.
- Control mode was displacement.
- Control algorithm was Proportional-Integral-Derivative (PID) with tuning optimized for each payload bandwidth, sample rate, and latency using an autotuner. Optimized gains included: proportional gain on displacement error; delta-p stabilization gain; delta-p high-pass cut-in frequency.
For more details on this servohydraulic model, see Actuator Model.pdf , Actuator Transfer Functions.pdf, and PID Transfer Functions.pdf.
Control Fidelity (as a function of Sample Rate)
To determine the effect of sample rate on control fidelity, the system was analyzed with control sample rates of 2 kHz, 5 kHz, 10 kHz, and 20 kHz, and system bandwidths of 25 Hz, 50 Hz, and 100 Hz. Latency was the minimum possible:1.5 controller sample periods. Comparisons of closed-loop, disturbance, and open-loop frequency response appear on the following pages.
The plots clearly show that most of the benefit of increased sample rate is obtained by increasing the sample rate from 2 kHz to 5 kHz. Beyond that, there little improvement to be gained.
Effect of Sample Rate on a 25 Hz Bandwidth System
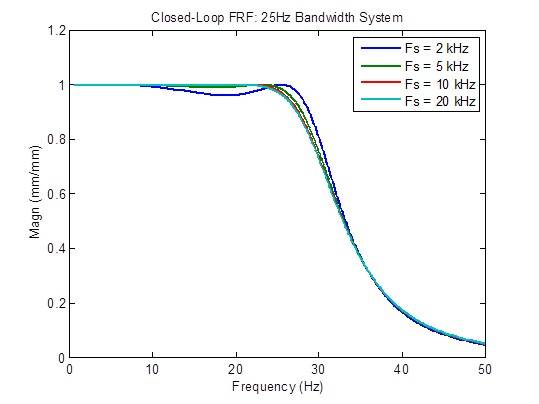
Closed-loop frequency response is somewhat improved (flatter) when the sample rate is increased from 2 kHz to 5 kHz. Beyond that, there is little improvement:
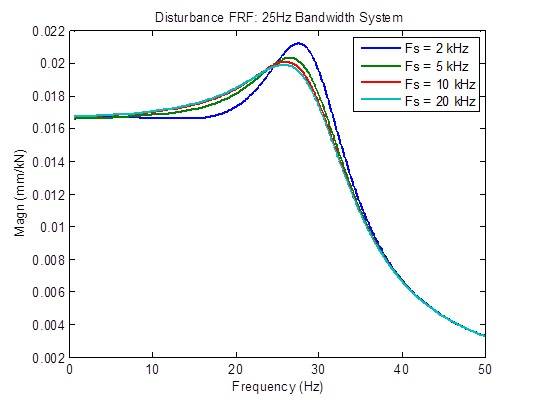
Disturbance response is somewhat improved (reduced) when the sample rate is increased from 2 kHz to 5 kHz. Beyond that, there is little improvement:
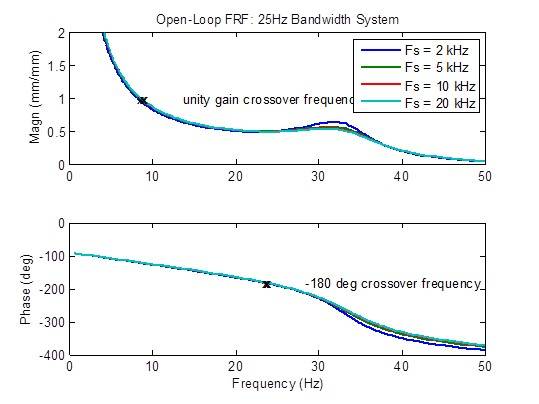
There is a slight reduction in peaking of open-loop frequency response when the sample rate is increased from 2 kHz to 5 kHz. Beyond that, there is little improvement. Stability metrics (crossover frequencies) are mostly unchanged:
Effect of Sample Rate on a 50 Hz Bandwidth System
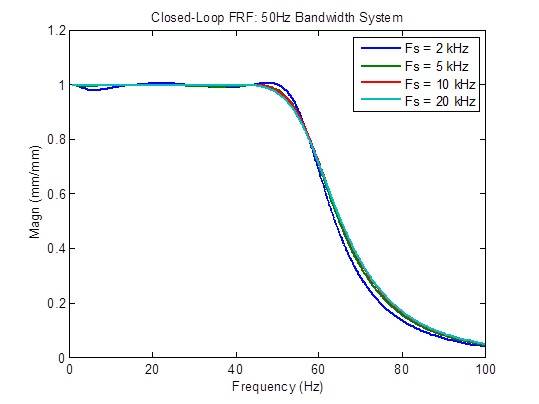
Closed-loop frequency response is slightly improved (flatter) when the sample rate is increased from 2 kHz to 5 kHz. Beyond that, there is little improvement:
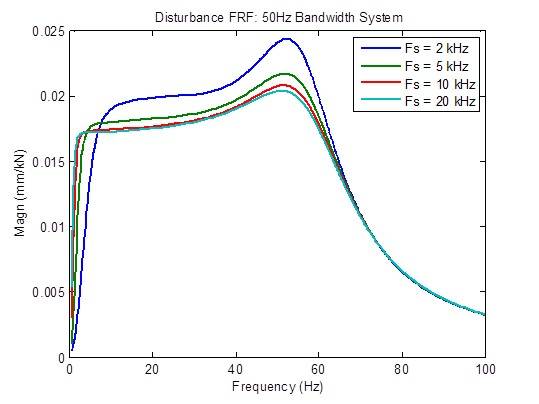
Disturbance response is moderately improved (reduced) when the sample rate is increased from 2 kHz to 5 kHz, and somewhat improved when the sample rate is increased from 5 kHz to 10 kHz. Beyond that, there is little improvement:
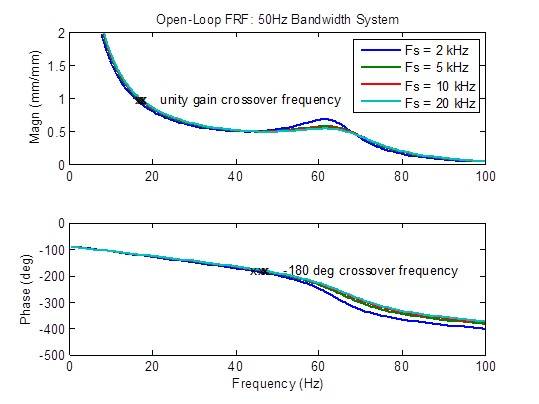
There is a slight reduction in peaking of open-loop frequency response when the sample rate is increased from 2 kHz to 5 kHz. Stability metrics (crossover frequencies) are also somewhat improved (higher frequency). Beyond that, there is little improvement:
Effect of Sample Rate on a 100 Hz Bandwidth System
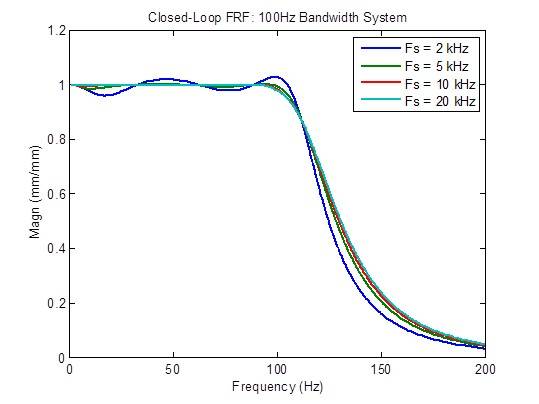
Closed-loop frequency response is significantly improved (flatter) when the sample rate is increased from 2 kHz to 5 kHz. Beyond that, there is little improvement:
Disturbance response is moderately improved (reduced) when the sample rate is increased from 2 kHz to 5 kHz, and somewhat improved from 5 kHz to 10 kHz. Beyond that, there is little improvement:
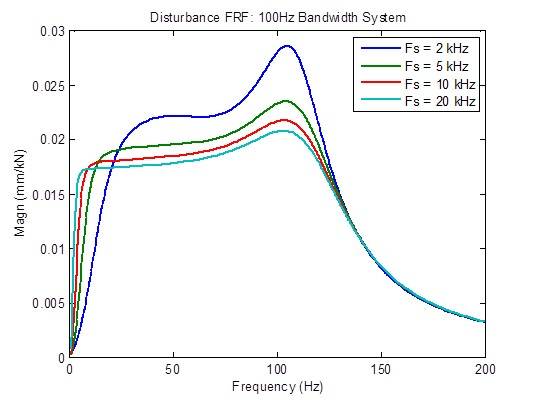
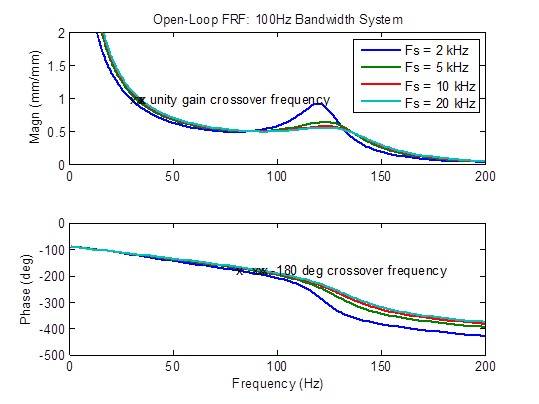
There is a moderate reduction in peaking of open-loop frequency response when the sample rate is increased from 2 kHz to 5 kHz. Stability metrics (crossover frequencies) are also moderately improved (higher frequency).Beyond that, there is little improvement:
Control Fidelity (as a function of Latency)
Increasing the sample rate will at some point overload a single real-time processor, a problem that can be resolved by adding more processors and sharing the computational load between them.
However, load sharing increases latency, which is defined as the number of samples of delay between reading sensor feedbacks and writing servovalve commands, according to the formula
Latency (samples) = number of processors + 0.5
The 0.5 figure is delay due to digital-to-analog conversion. The minimum possible latency possible is 1.5 samples, which occurs when only one processor is present. The latency due to the number of processors arises because of the need to synchronize passage of signal data from one processor to the next.
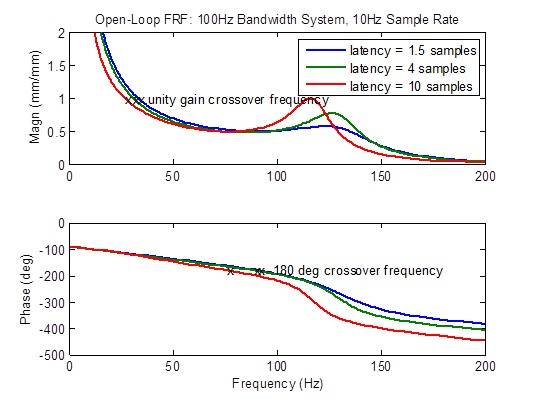
To determine the effect of latency on control fidelity, a system with 100 Hz bandwidth and a sample rate of 10 kHz was analyzed with latencies of 1.5, 4, and 10 samples. Comparisons of closed-loop, disturbance, and open-loop frequency response appear on the following pages.
The plots below clearly show that control fidelity degrades significantly when latency is increased beyond the minimum of 1.5 samples. This demonstrates that adding processors to achieve a high sample rate is not necessarily a good thing, and that it might be better to use a lower sample rate that is within the capability of a single processor.
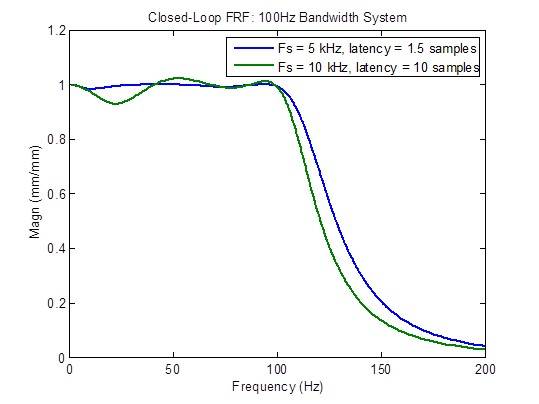
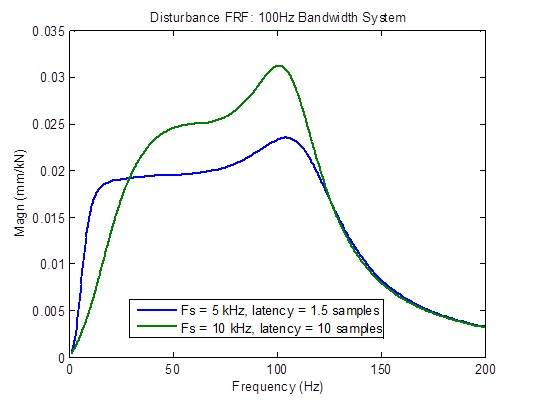
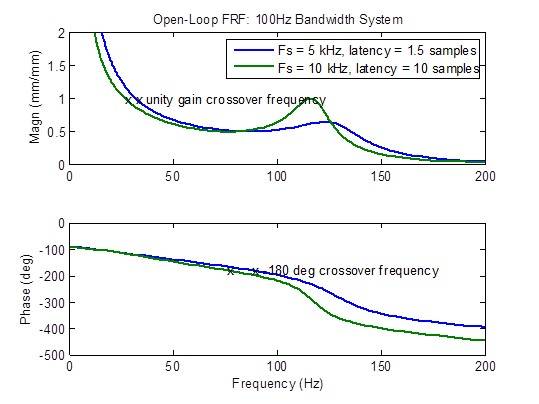
Note: The reason why 10 kHz sample rate and a maximum latency of 10 samples was chosen for this analysis is because these are the specifications of a controller offered by an MTS competitor. The final plots in this section compare this competitor’s controller with a controller that has the optimum sample rate of 5 kHz and the minimum latency of 1.5 samples; the competitor’s controller is clearly inferior.
Effect of Latency on a 100 Hz Bandwidth System with a 10 kHz Sample Rate
Closed-loop frequency response degrades (becomes less flat) considerably when the latency is greater than the minimum of 1.5 samples:
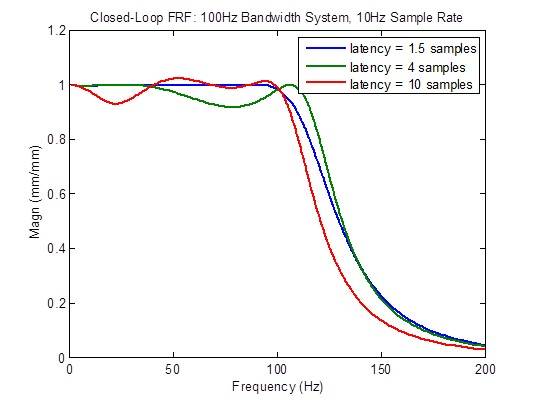
Disturbance response degrades considerably (becomes higher) when the latency is greater than the minimum of 1.5 samples. However, there is an improvement at low frequencies due to reasons unknown at this time:
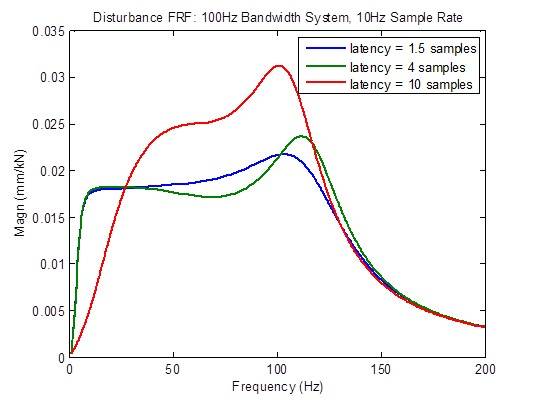
Open-loop frequency response degrades (develops peaks) considerably when the latency is greater than the minimum of 1.5 samples. Stability metrics (crossover frequencies) degrade (occur at lower frequency) considerably:
Comparison of a 100 Hz Bandwidth System with a 10 kHz Sample Rate with High Latency versus a 5 kHz Sample Rate with Minimum Latency
An MTS competitor claims to have a 10 kHz sample rate controller with 1 millisecond latency (10 samples @ 10 kHz). The frequency plots below clearly show inferior response in every respect in comparison to a 5 kHz sample rate with minimum latency (1.5 samples): reduced bandwidth, non-flat closed-loop frequency response, higher disturbance response, and degraded stability margins.
Numerical Effects
Detrimental numerical effects such as coefficient quantization and roundoff error worsen with increasing sample rate, and manifest themselves in several ways:
Integrative processes have unpredictable integration rates or can get stuck: Examples of such processes include ramp function generators and PID controller integrators. Taking ramp generation as an example, the formula below generates a ramp value at time k by adding a delta value Δ = integration rate / sample rate to the previous output at time k - 1:
yk = yk-1 + Δ
| 1 kHz | 10 kHz | 100 kHz | |
| a1 = -1.991114 | a1 = -1.999111 | a1 = -1.999911 | |
| a2 = 0.991154 | a2 = 0.999112 | a2 = 0.999911 | |
Only a1 and a2 coefficients are of interest, because they are the ones that determine stability and are most susceptible to roundoff error and quantization effects. Note as the sample rate increases, the number of digits that are not 9 decreases. This means that there are much fewer digits that determine filter response. Eventually, as the sample rate is increased further, coefficient a1 approaches a value of -2.0 and a2 approaches a value of 1.0. At some point, filter coefficient quantization could result in a filter whose frequency response is erratic or even unstable, where the output oscillates with large value even with zero input.

